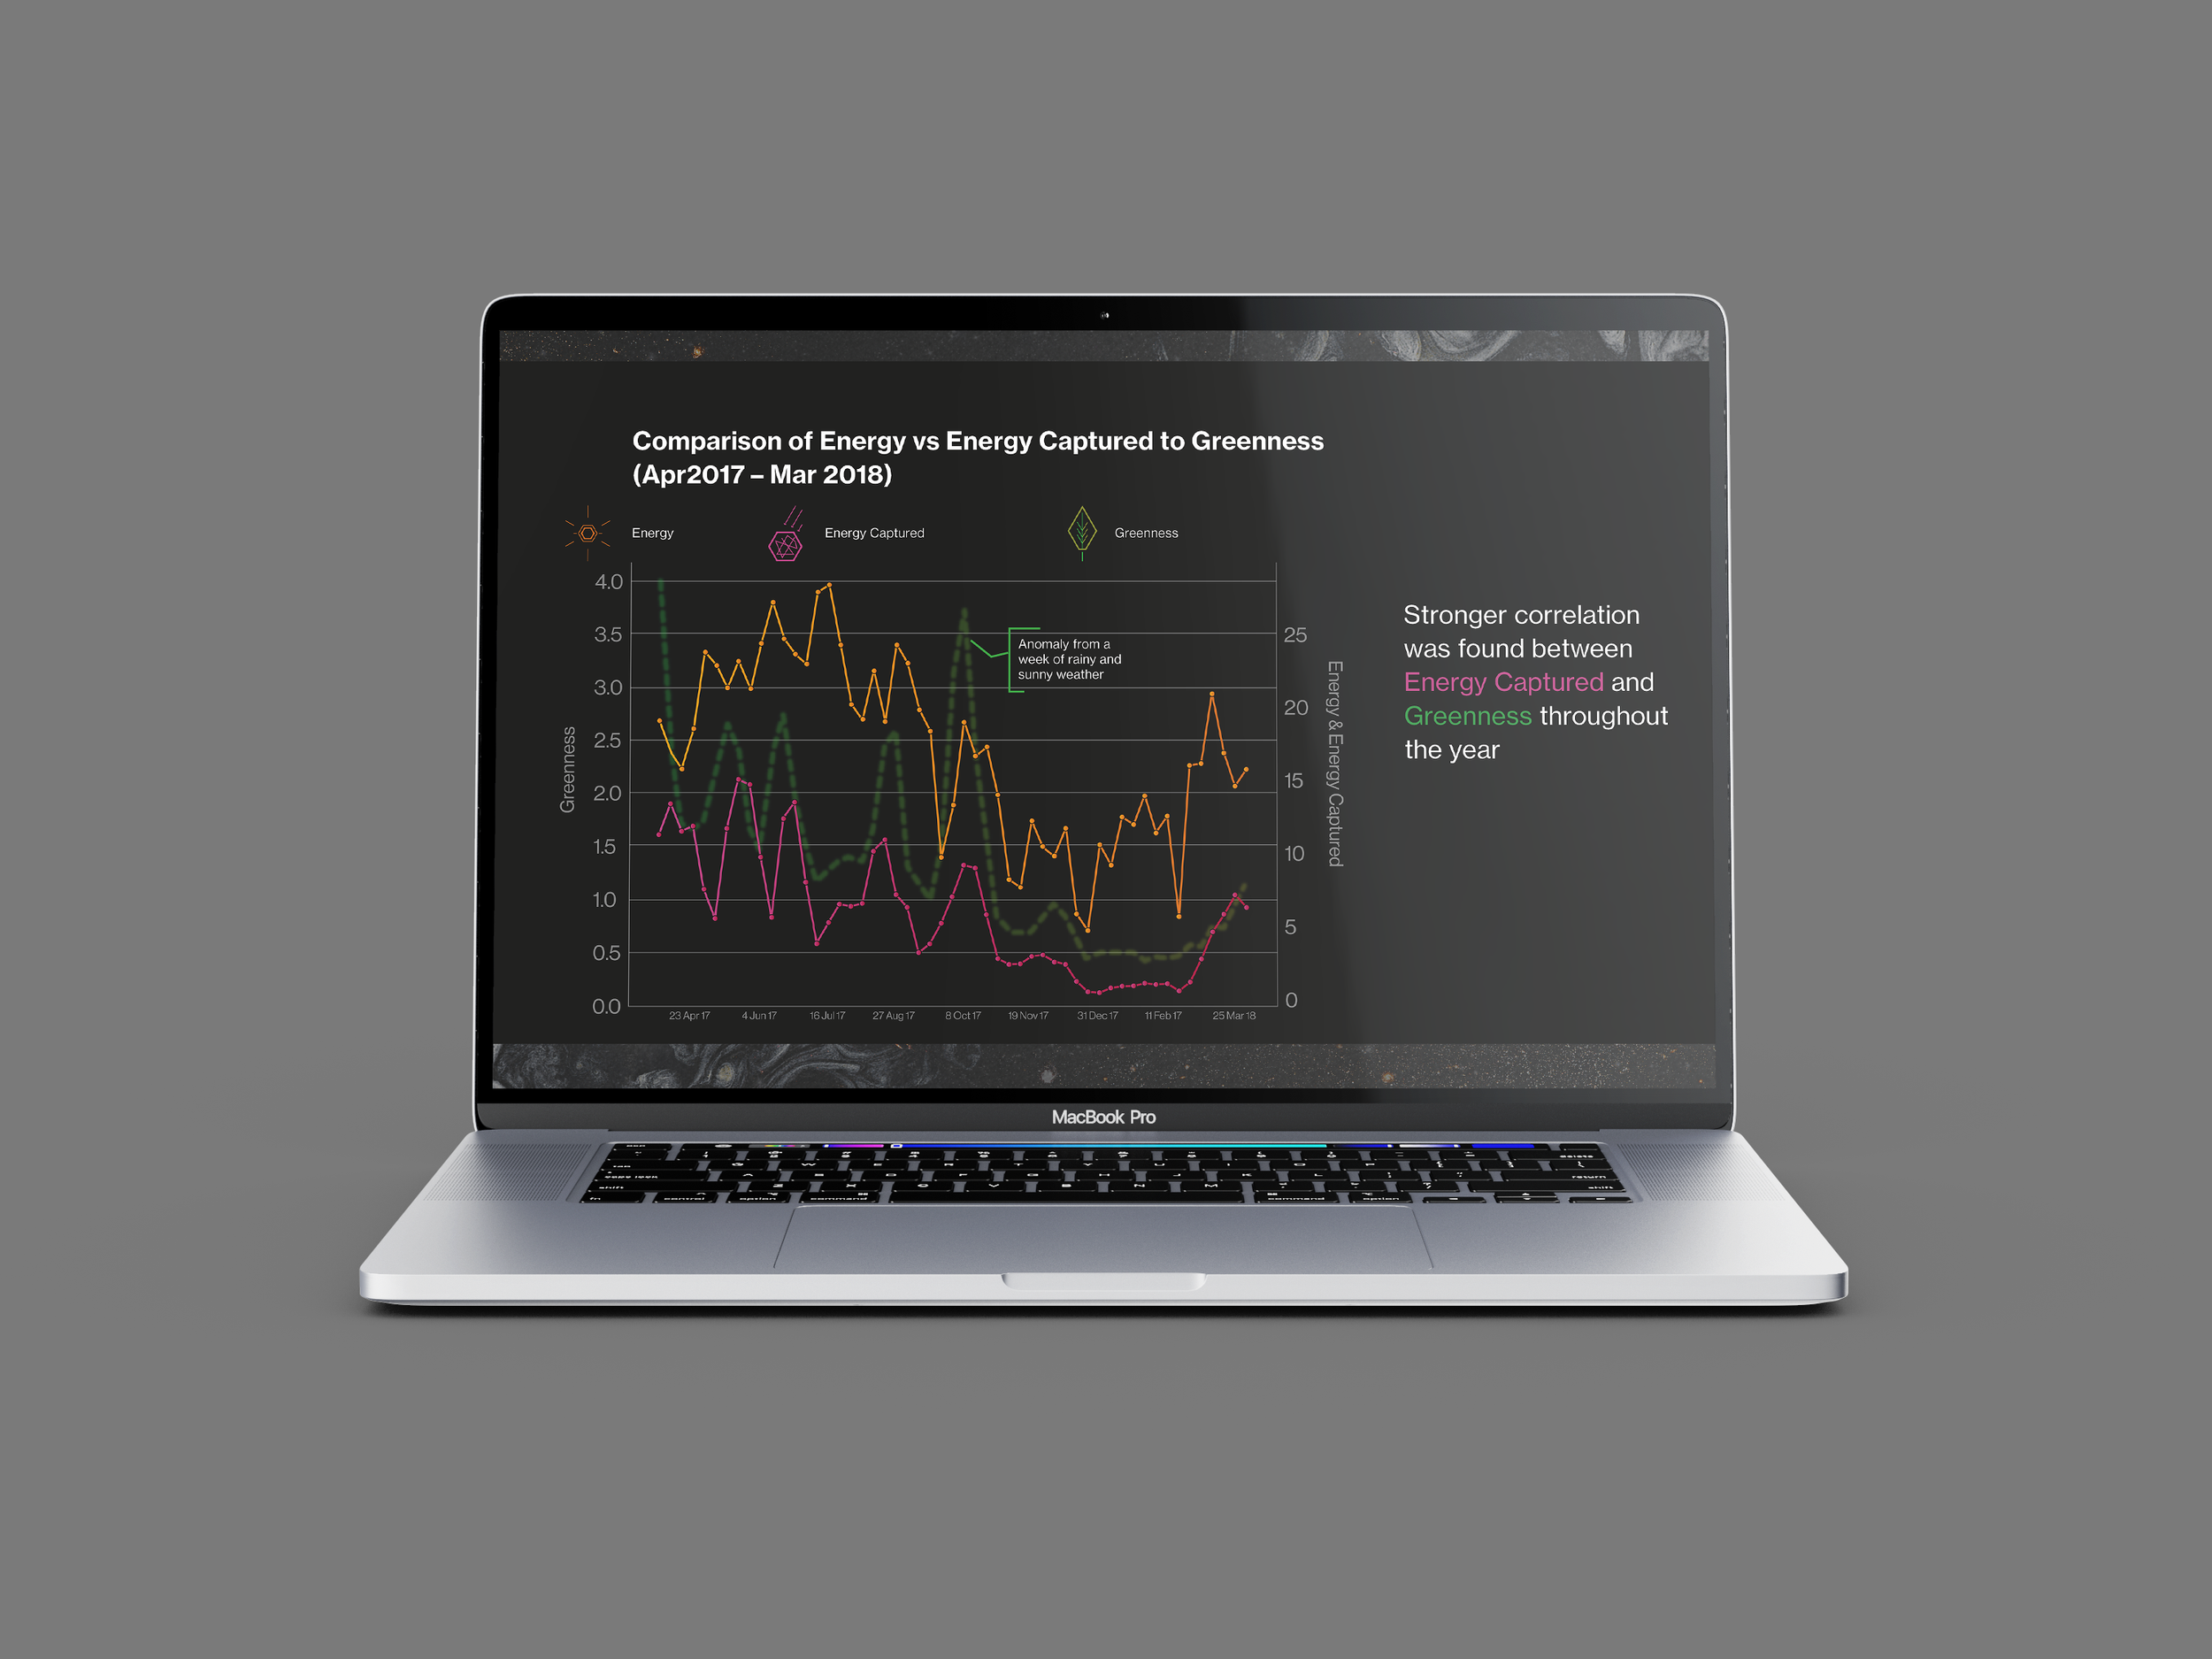
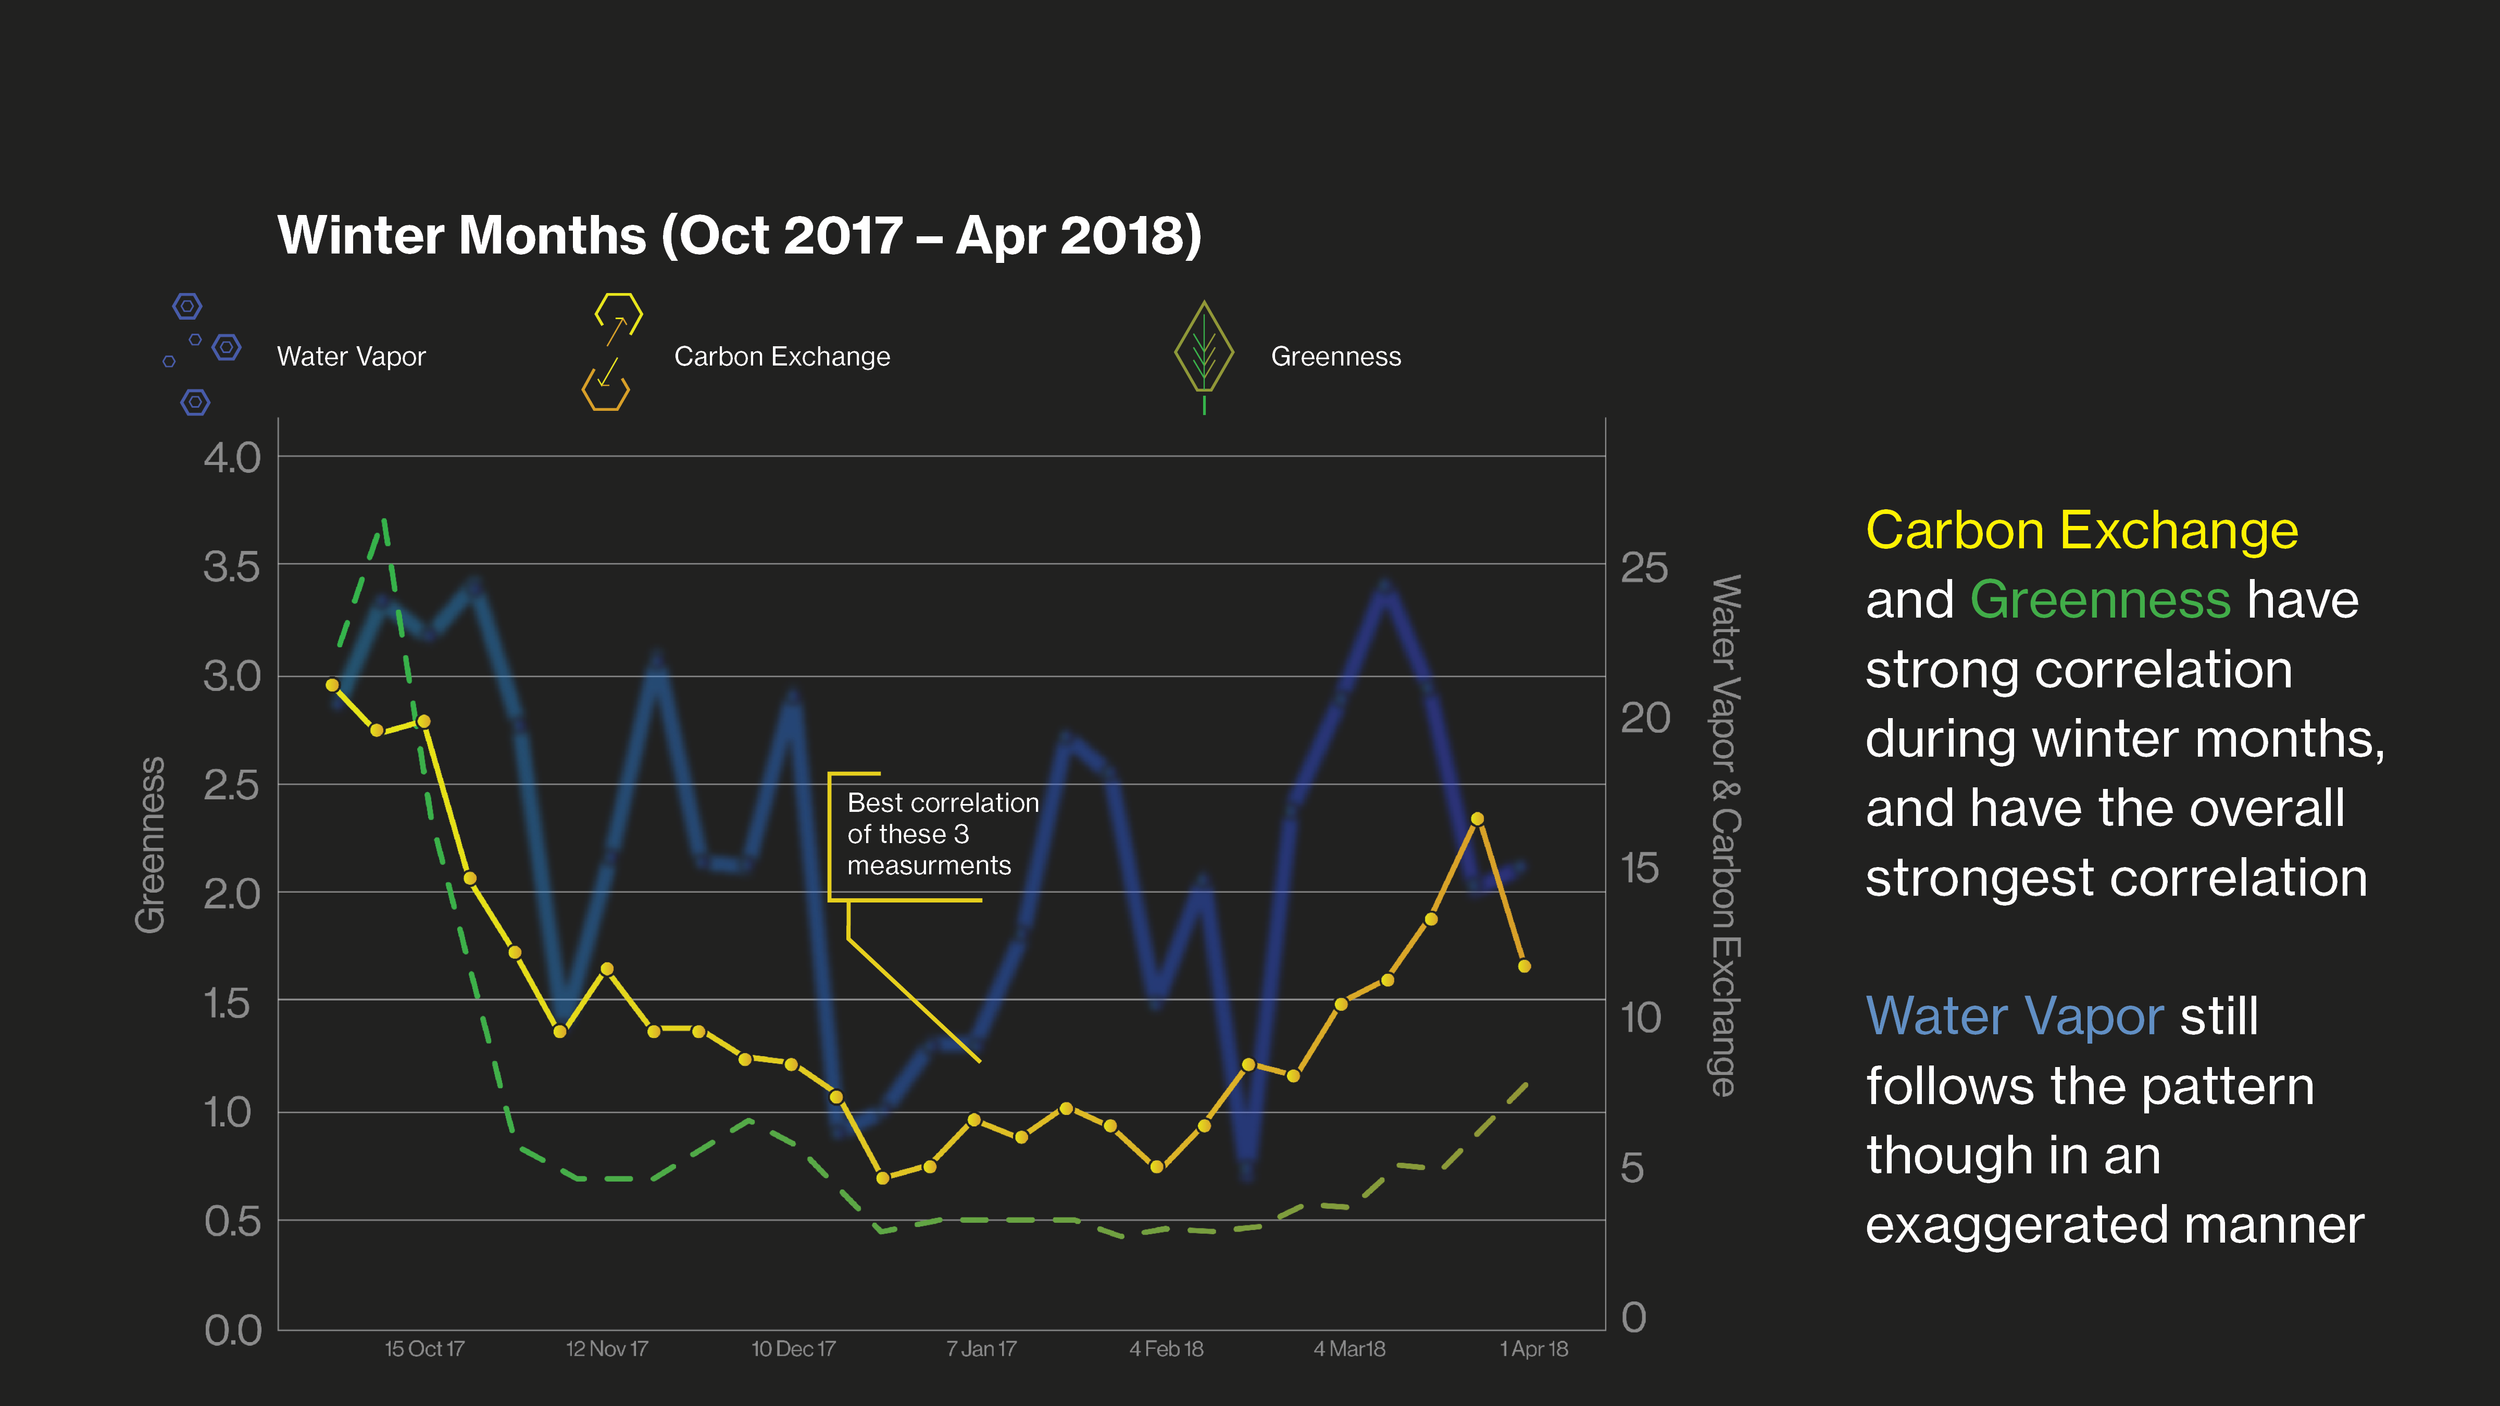
At the El Reno Grazing Lands Research Lab, data was collected from an experimental plot using three types of reading: weather measurements, satellite measurements, and in-field/soil measurements. Each have their own advantages and disadvantages
Using this data, we were to find interrelations among the measurements and create a visualization system that can bring meaning to farmers and aid them in making better decisions.
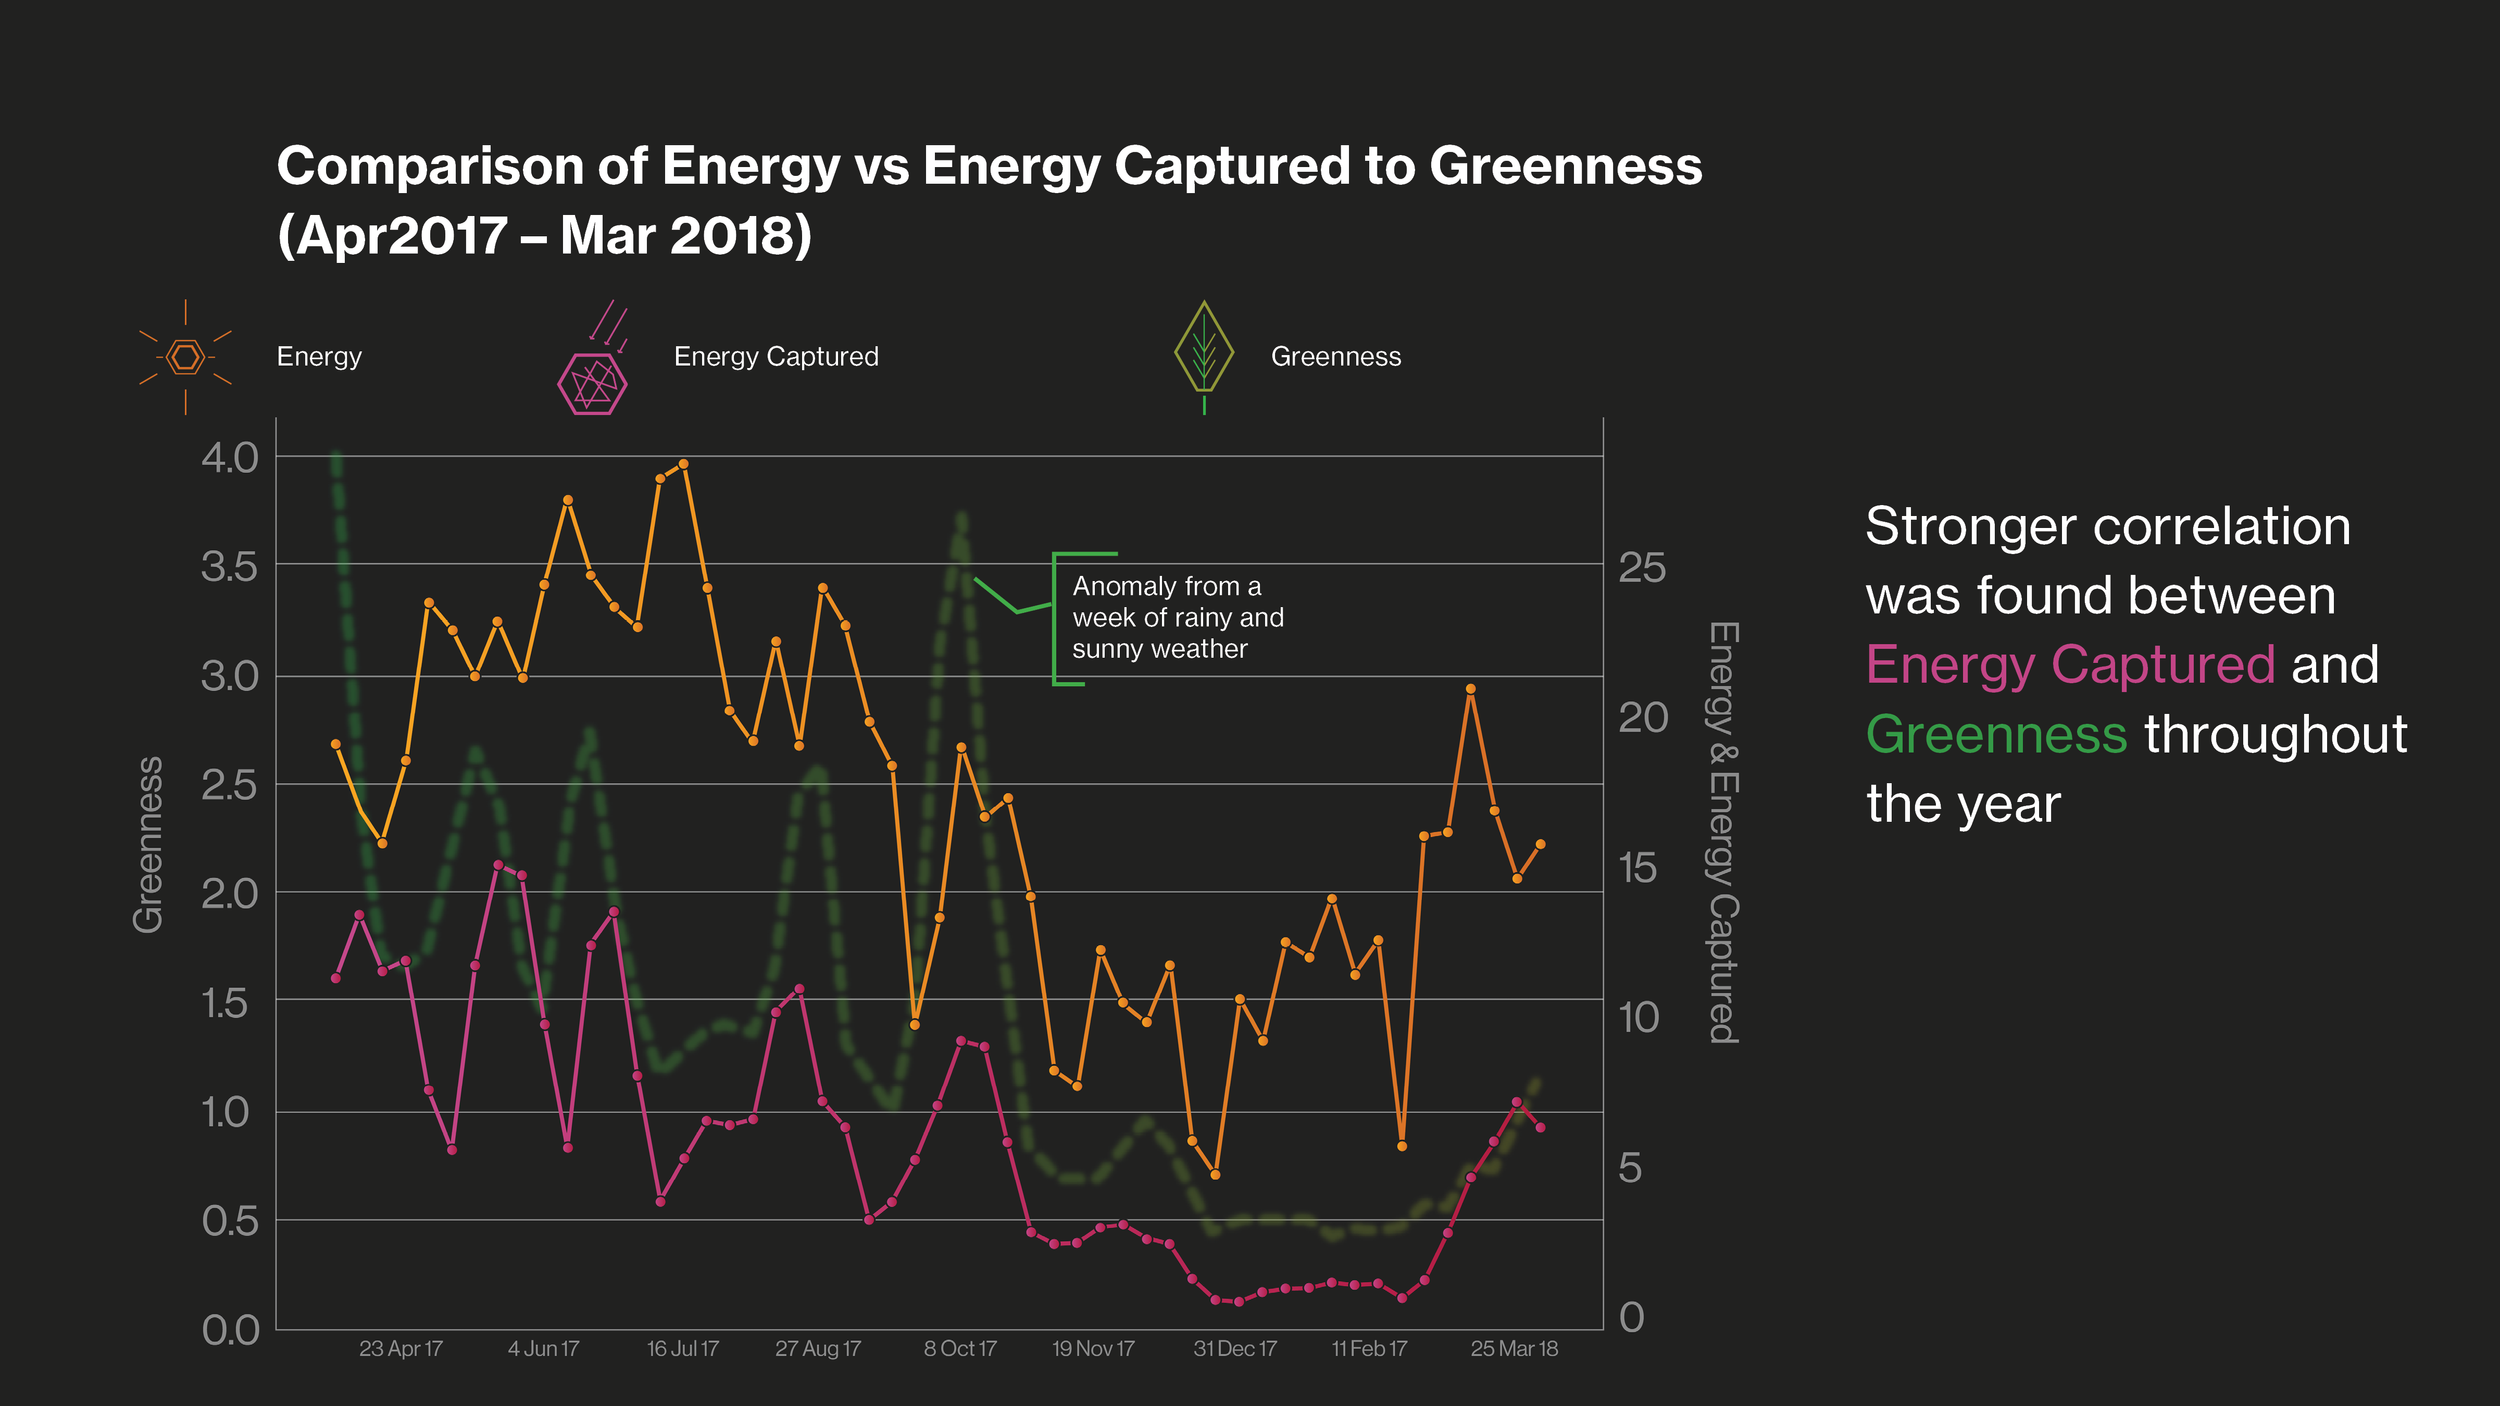
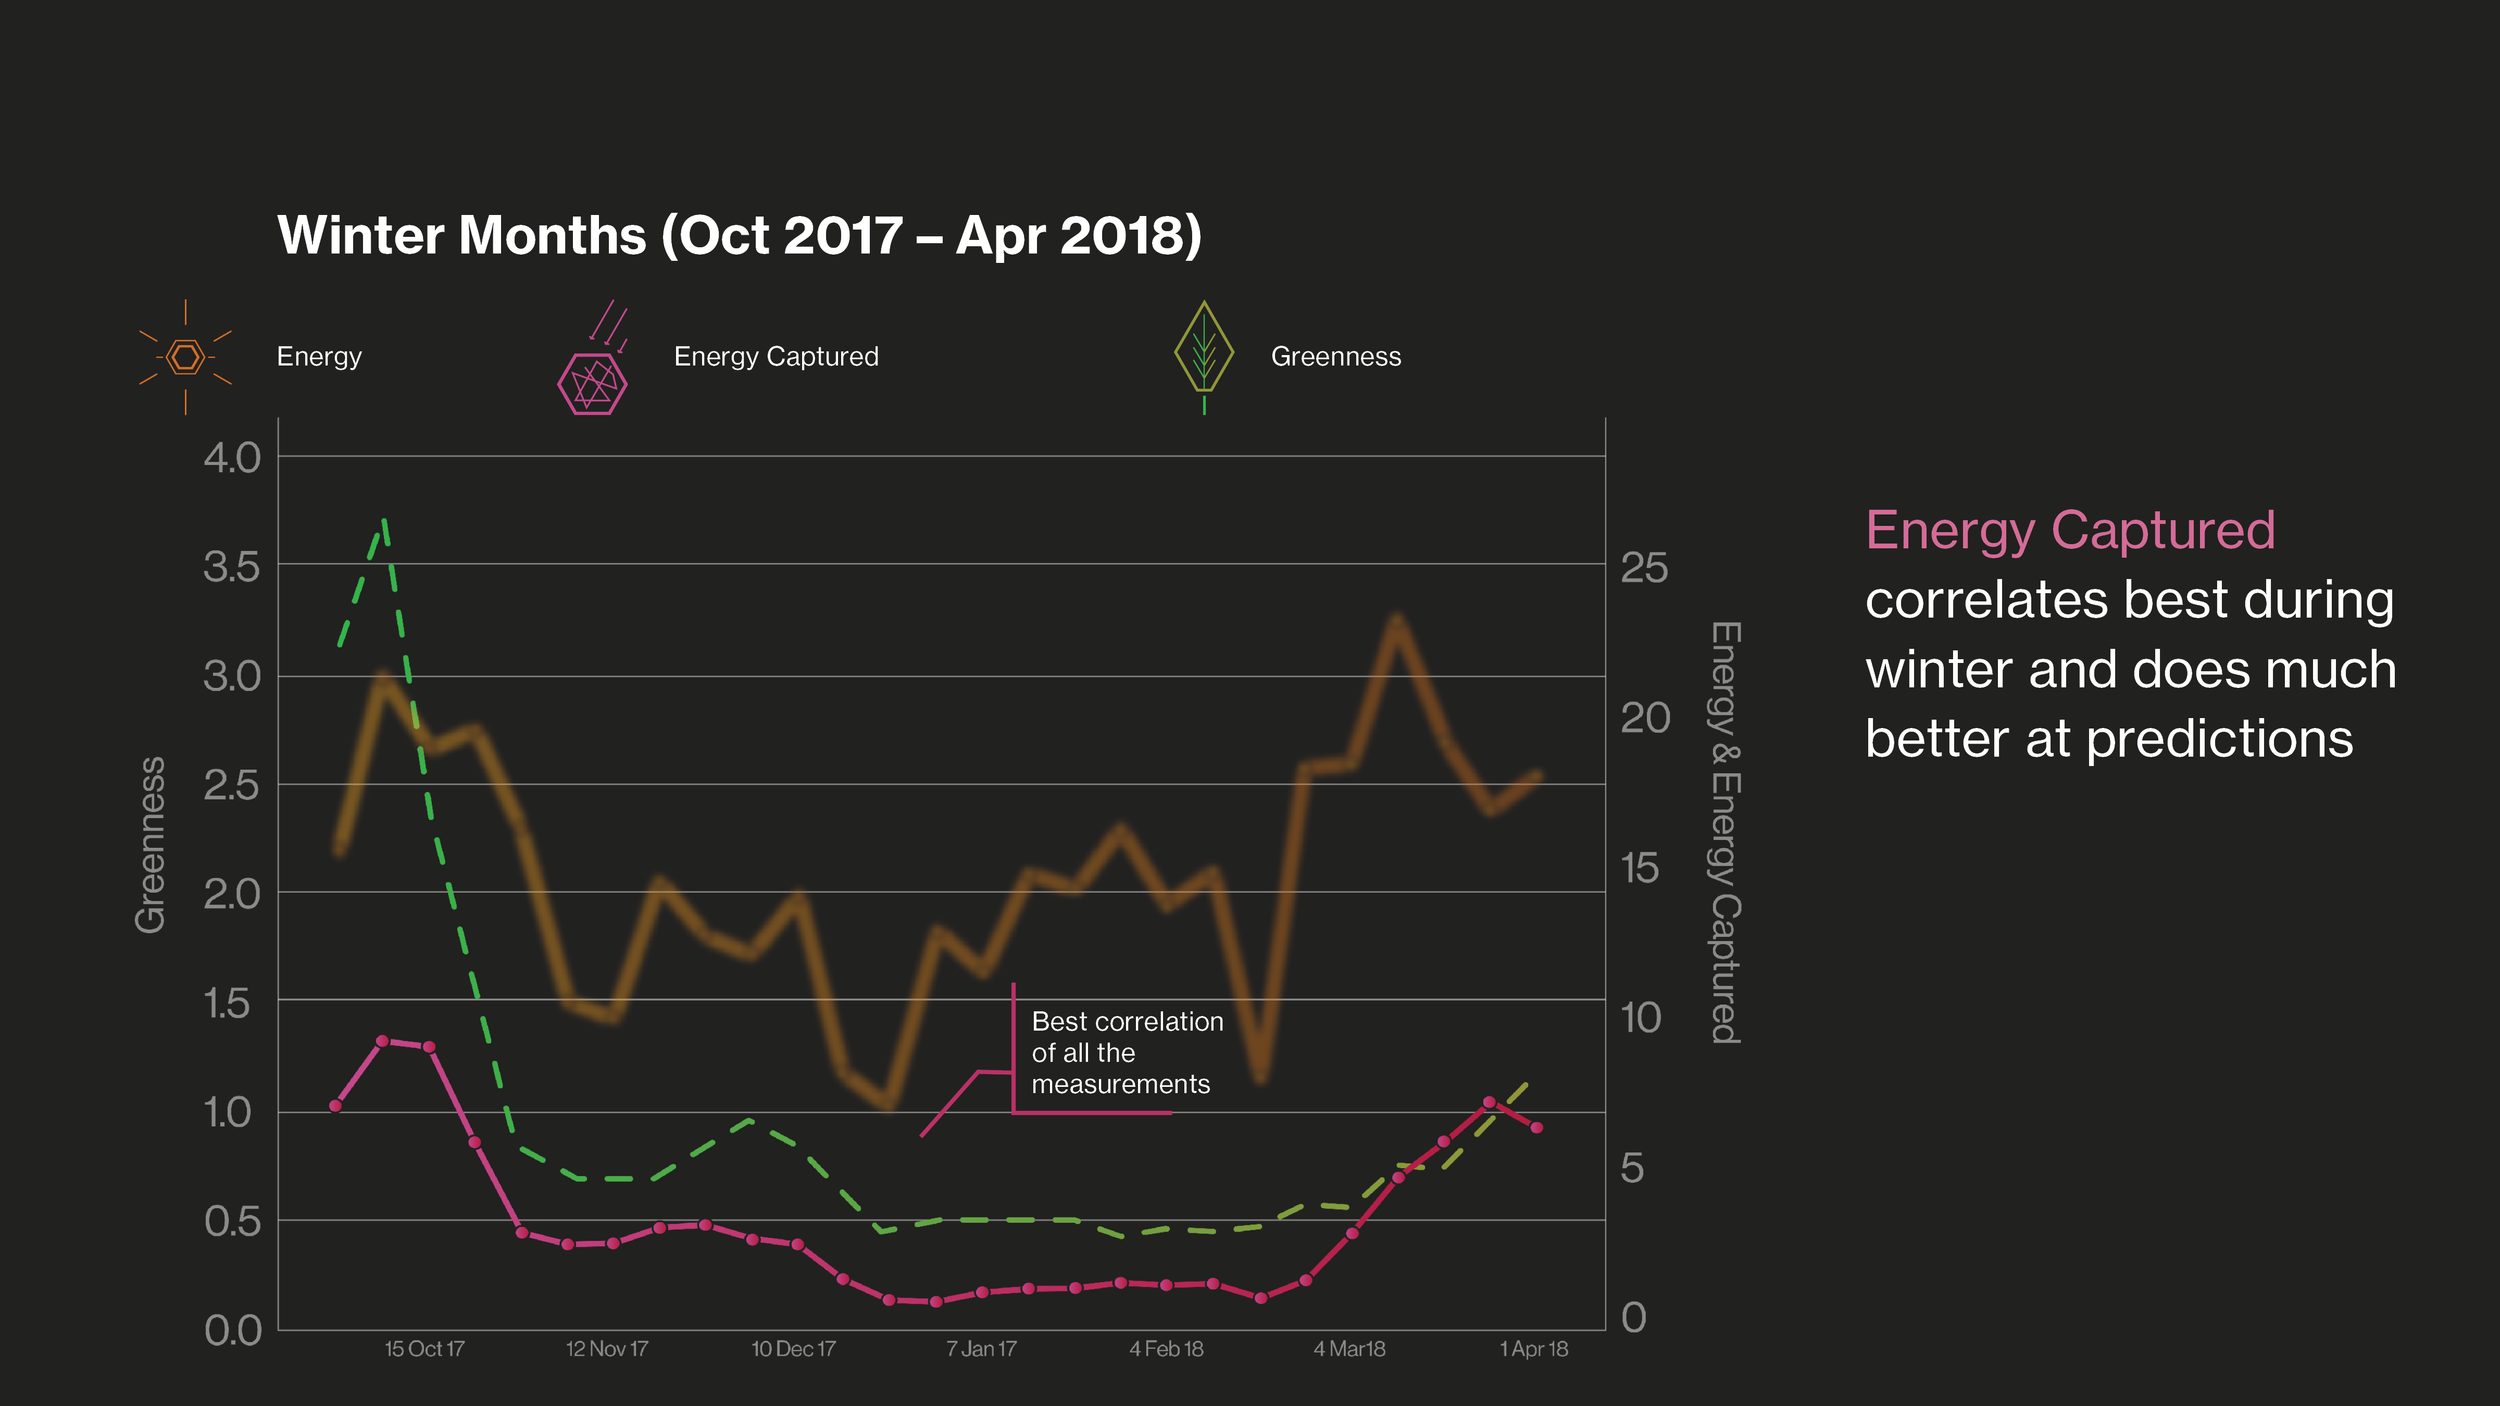
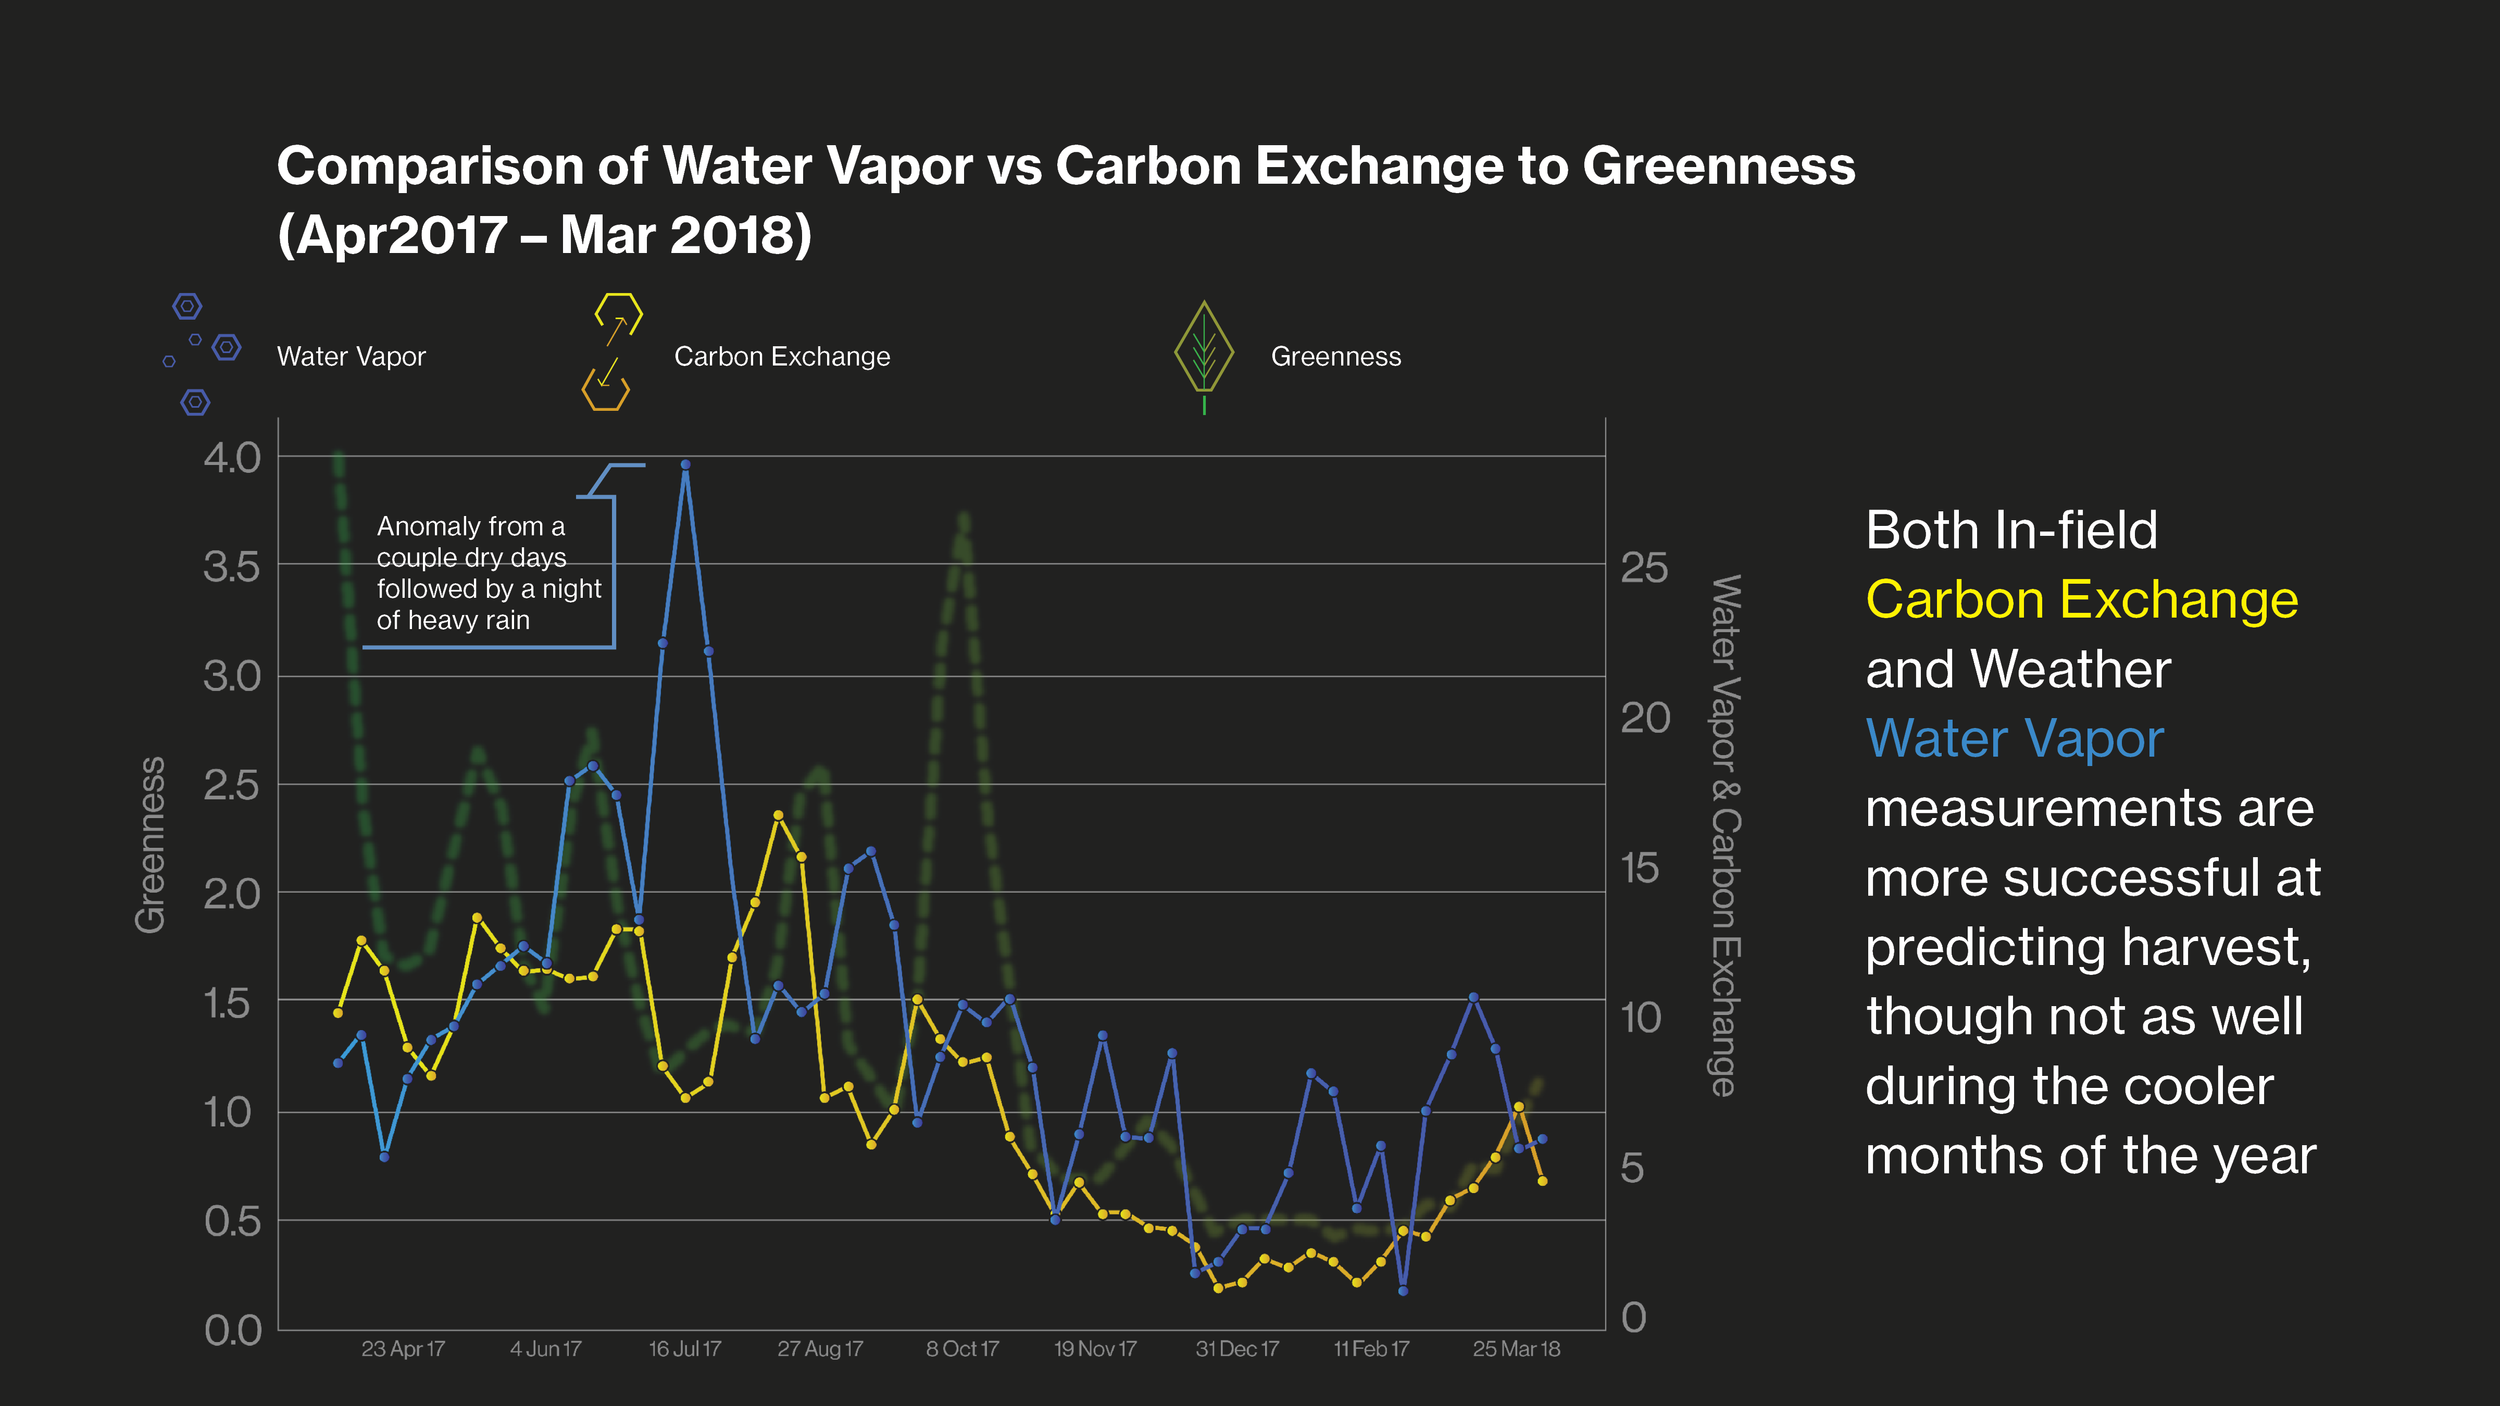
The approach taken here was to make two sets of graphs; both sets having a different weather
and in-field measurement, but comparing those measurements to the same satellite measurement, Greenness. Special icons were also illustrated to further clarify which measurements were being observed. They hexagonal in shape to convey community with sharp sleek corners to give a professional feel throughout the series.


